Build Forensics

Make build failures explainable.

When build becomes shared infrastructure, failures stop being local. They become distributed, concurrent, and expensive. A red CI badge isn’t enough. Platform teams need answers: What changed? Where did time go? Was this a flaky test? Did remote execution behave differently? Which artifacts were produced? Which action failed first? What is the blast radius?

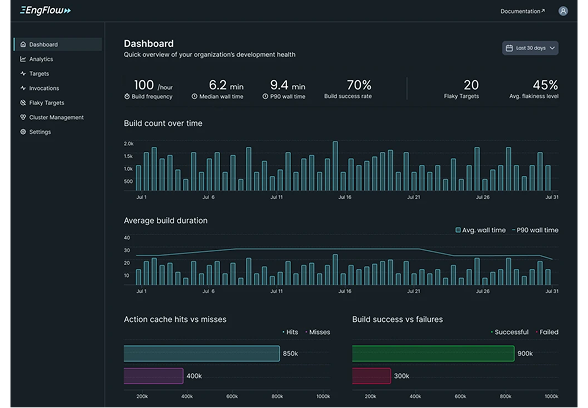
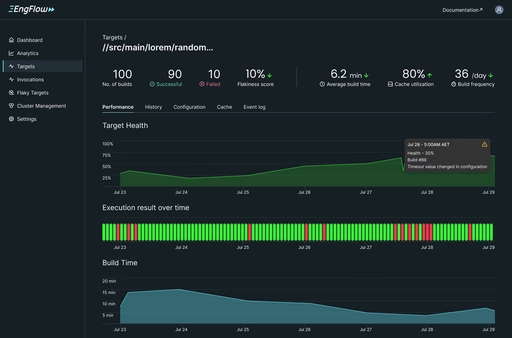
EngFlow’s Build and Test UI is Build Forensics for Bazel at scale: a centralized, searchable record of every invocation—local or remote—so teams can diagnose faster, reduce repeats, and operate build like production.

Why Debugging Breaks at Scale

Most organizations debug builds with a mix of logs, tribal knowledge, and Slack threads. That works until concurrency and change velocity explode. Then the failure modes look like this:

“Works on my machine” vs CI differences no one can pinpoint
Long, noisy logs with no structured context
Intermittent failures that never reproduce on demand
Slow root-cause because data is scattered across runners and laptops
Recurring incidents because nobody can see patterns across builds

If you can’t explain failures quickly, you can’t operate build safely. Upgrades get delayed, confidence erodes, and incident cost rises.

What you get with Build Forensics

A single place to answer “why” for any build.

Explain any invocation

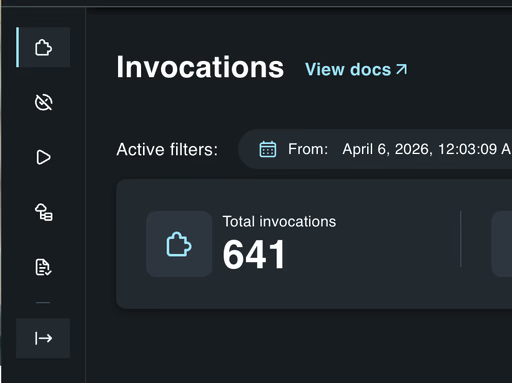
Inspect builds from developer machines and CI in the same interface. See what ran, what failed, what changed, and what artifacts were produced.

Search across builds

Stop hunting through pipelines and logs. Find similar failures, specific targets, specific tests, specific users, or specific time windows—then compare runs.

Time and performance attribution

See where time goes across the build graph: critical path, slow actions, queueing, downloads, remote execution, test time, and bottlenecks. Move from “it’s slow” to “this is the constraint.”

Failure forensics, not log reading

Drill into the first failing action, its inputs/outputs, execution context, and dependencies. Understand whether the failure is deterministic, environmental, or flaky.

Cross-invocation analysis

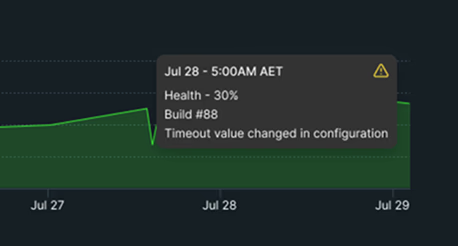
Compare builds to isolate causality: flags, toolchain versions, remote vs local behavior, cache state, or dependency drift. Turn “something changed” into “this changed.”

Flake resistance and hygiene

Identify tests that fail intermittently, quantify impact, and track trends. Treat flakiness as a system behavior you can measure and reduce—not a permanent tax.

Operational visibility for platform teams

Build Forensics gives platform owners the telemetry needed to run upgrades, manage capacity, and reduce incident frequency—without relying on heroics.

How it works

Build Forensics captures build and test metadata as part of normal engineering workflows.

Developers and CI run builds and tests as usual.

EngFlow captures structured build telemetry and metadata for each invocation.

The UI indexes that data so it’s searchable, comparable, and analyzable.

Teams use evidence—across invocations—to diagnose quickly and prevent repeats.

This is the difference between “a build system” and “a build service.”

Key Capabilities

Invocation explorer

A clear, structured view of a build: targets, actions, tests, timing, and outcomes.

Graph-level understanding

Navigate the build graph to see dependencies, critical paths, and where failures originate.

Test insights

Surface test failures with context: timing, environment, retries, and flake signals.

Artifact lineage

Understand what was produced, where it came from, and what depended on it—especially important as artifacts grow.

Trends and reporting

Track reliability and performance over time. Identify regressions and recurring failure patterns.

Integrates with how you run build

Works whether you’re primarily local, primarily CI, or fully remote-executed. The point is unified visibility.

Outcomes you can measure

Faster iteration and less variance

Developers wait less, more consistently—not just on “good days.”

More resilient CI

Less load on runners; fewer queueing cascades when concurrency spikes.

Lower compute waste

Fewer repeated compiles and tests across the organization.

Lower cloud spend (and fewer surprises)

Storage and egress become governable, with the levers to tune cost without slowing engineers.

Who this is for

Platform and build teams operating shared build infrastructure.Organizations with high concurrency, growing artifacts, or distributed teams.Teams standardizing on Bazel or supporting mixed toolchains where reuse and consistency matter.

Product connections

Remote caching compounds when paired with:

Remote Execution

Offload work to a cluster; caching reduces the work the cluster must do.

Build Forensics (Build and Test UI)

Make cache misses and invalidations explainable; improve cacheability with evidence.

Remote caching should feel boring: high hit rates, predictable performance, and costs you can control.